|
H46: Measurement of Print
|
©
James H Nobbs
[Colour4Free]
|
|
|
|
Measurement of print
The colour parameters XYZ or
L*a*b* are not related in a simple way to the characteristics of the
half-tone image. Densitometry refers to the measurement
process used to describe the print “density” characteristics of images
produced by the four-colour printing process.
Reflection density is widely
used for quality and process control within the graphic arts
industry. Once the half-tone characteristics of a visually
acceptable print is established, densitometry offers a way of assessing
the properties of a print using parameters that are directly related to
the halftone process. The information from the instrument can
be used to monitor the production process so that corrections and
adjustments of the press can be made in order to maintain acceptable
reproduction.
The methods and terms used
here follow the practice of the Committee for Graphic Arts Technologies
Standards (CGATS).
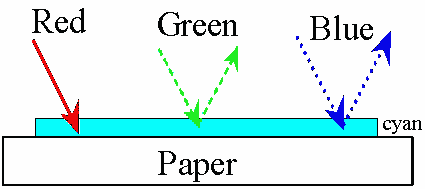
Printed colour
|
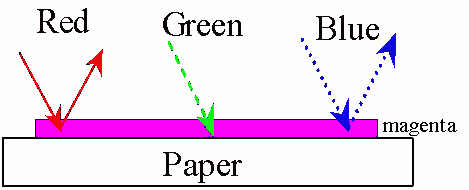
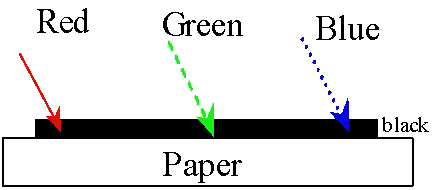
Printed
layers are usually semi-transparent which means that the incident light
can interacted with the material in a number of ways, as is illustrated
in Figure 1. The light could be reflected light by the air to
coating boundary or it could be scattered by the pigment particles
within the ink layer. It could also be transmitted through
the layer, reflected by the substrate and then transmitted, back out of
the system.
|
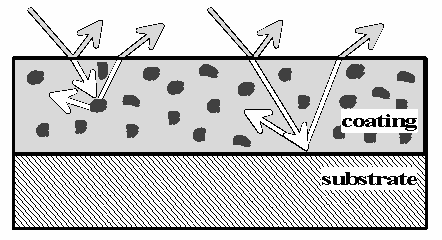
Figure 1: Light reflection by a
semi-transparent layer
|
It is
helpful to understand the way which the dot-areas of a half-tone
pattern are related to the amounts of light in the red wavelength band
(R), in the green wavelength band (G) and in the blue wavelength band
(B) that are reflected by each area of the print.
Colour mosaic
In the
case of half-tone printing, only eight different coloured dots are
produced. Typical colour separation values (amounts of light
in the red, green and blue wavelength bands) for each type of dot
relative to those of the white substrate are shown in Table 1.
|
|
Table 1: Reflectance values of single print
and overprints of the process colours
|
|
|
|
Dot
Type (i)
|
Dot
Colour
|
%
Red, r(i)
|
%
Green, g(i)
|
%
Blue, b(i)
|
|
|
|
1
|
White
|
100.0
|
100.0
|
100.0
|
|
|
|
2
|
Cyan
|
5.38
|
39.54
|
63.35
|
|
|
|
3
|
Yellow
|
97.77
|
88.86
|
10.95
|
|
|
|
4
|
Magenta
|
88.75
|
8.14
|
39.01
|
|
|
|
5
|
Red
|
86.91
|
6.74
|
2.94
|
|
|
|
6
|
Green
|
5.27
|
33.39
|
7.35
|
|
|
|
7
|
Blue
|
4.88
|
3.53
|
23.89
|
|
|
|
8
|
Black
|
4.78
|
2.66
|
1.95
|
|
All the
colours available in the printed image are formed by changing the area
occupied by of each type of dot in the mosaic of dots in a localised
area of the print. The area of a single dot is so small that
there will be several hundred even in the smallest part of the image
that the eye can resolve. The colour seen by the eye in each
part of the image arises from the blending of the light reflected by
the mosaic of dots. Each type of dot will contribute a
proportion of light from the red, green and blue bands of the spectrum
and the net effect is determined by the sum of these contributions.
Densitometer: c y m k
|
The
densitometer is the workhorse instrument of the printed colour
reproduction industry. Each step of the production can be
monitored by the values recorded by the densitometer. The
principle of the reflectance densitometer is shown in Figure 2.
Light from a tungsten
filament lamp that simulates the CIE type A illumination is collimated
into a parallel beam of rays and shone onto a small, well-defined, area
of the printed surface.
|
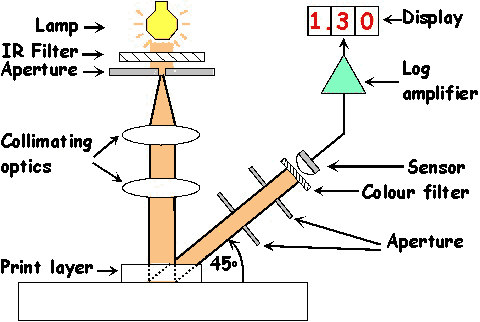
Figure 2: The 0/45 optical
arrangement of a densitometer
|
Light
reflected by the printed surface is collected at an angle of 45°
to the surface, as defined by a pair of apertures. The
spectral character of the 45° light is analysed using optical filters to
determine the amounts of light in four bands of wavelengths; red,
green, blue and visual. National and International Standards
establish the characteristics of the filters and of the weighting
functions.
The densitometry standards
allow the positions of illumination and collection to be reversed to
provide an alternative design for the instrument. In the 45/0
arrangement light is shone onto the print surface at 45°
to the surface and the reflected light is collected normal to the
surface.
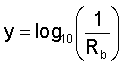
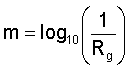
R: Reflectance factor
In all cases the reflectance
factor is defined as the ratio of the amount of filtered (or weighted)
light detected from the sample relative to the amount of filtered (or
weighted) light detected from a perfect white diffuser measured under
the same conditions. In normal use the term “reflectance” is
used rather than “reflectance factor”.
|
|
Rv
|
Visual
filter reflectance: the reflectance for spectral analysis by
the filter that transmits across all visible wavelengths.
|
|
|
Rr
|
Red
filter reflectance: the reflectance for spectral analysis by
the filter that transmits in the red wavelength band.
|
|
|
Rg
|
Green
filter reflectance: the reflectance for spectral analysis by
the filter that transmits in the green wavelength band.
|
|
|
Rb
|
Blue
filter reflectance: the reflectance for spectral analysis by
the filter that transmits in the blue wavelength band.
|
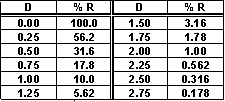
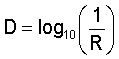
D: Optical density
|
The optical density,
also known as the reflection density, is a measure of the light
absorbing property of a material, so that higher density values
indicate that more light is being absorbed. The values of R
and D over the range 0 to 3 are given in Table 2. It is
determined from the logarithm of the reciprocal of the reflectance.
|
Table 2: Reflectance and density values
|
|
Equation
1
|
|
C or
red-filter density: DR
|
The
cyan ink layer transmits blue and green light and absorbs red
light. It follows that the cyan density unit depends on the
fraction of red light reflected by the surface.
|
|
|
|
|
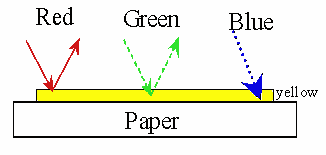
Y
value or blue-filter density DB
|
The
yellow ink layer transmits red and green light and absorbs blue
light. It follows that the yellow density unit depends on the
fraction of blue light reflected by the surface.
|
|
|
|
|
M
value or green-filter density DG
|
The
magenta ink layer transmits red and blue light and absorbs green
light. It follows that the magenta density unit depends on
the fraction of green light reflected by the surface.
|
|
|
|
|
K value or visual-filter density: DV
|
The
black ink layer transmits absorbs throughout the spectrum. It
follows that the black ink density unit depends on the fraction
reflected by the surface, irrespective of wavelength.
|
|
|
|
|
Typical
values
|
Typical
optical density values for a solid print are given in Table
3. They are the UGRA/FOGRA recommended values for
measurements made under Status E filter response.
|
Table 3: Example solid ink densities (Europe
Status E)
|
|
Type
of substrate
|
Type
of ink
|
|
Black
Dv
or k
|
Cyan
Dr
or c
|
Magenta
Dg
or m
|
Yellow
Db
or y
|
|
Glossy
paper
|
1.85
|
1.45
|
1.40
|
1.40
|
|
Coated
paper, mat
|
1.75
|
1.35
|
1.30
|
1.30
|
|
Uncoated
paper
|
1.55
|
1.20
|
1.15
|
1.20
|
|
Newsprint
|
1.55
|
1.20
|
1.15
|
1.20
|
The
density values will naturally vary slightly during a print run, a
typical range of variation when operating to a close tolerance is ±0.05D
units
Analysis filter characteristics
Densitometers use optical
filters with a transmission characteristic similar to the filters used
in the colour separation process of printing plate
production. There are two major types of response in common
use for reflection densitometry, Status T (USA) and Status E
(Europe). It is important that the Status response of the
densitometer is included in any specification or report of density
values.
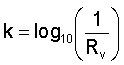
Status E
Status
E is generally accepted in the UK and Europe as the Wide Band Graphic
arts filter response characteristics, see Figure 3. It has
the advantage over the USA based Status T response in that the c y m
density values of prints from a balanced set of process inks are
similar in value. A balanced set of inks will print a
neutral, achromatic colour for overprints of cyan magenta and yellow.
|
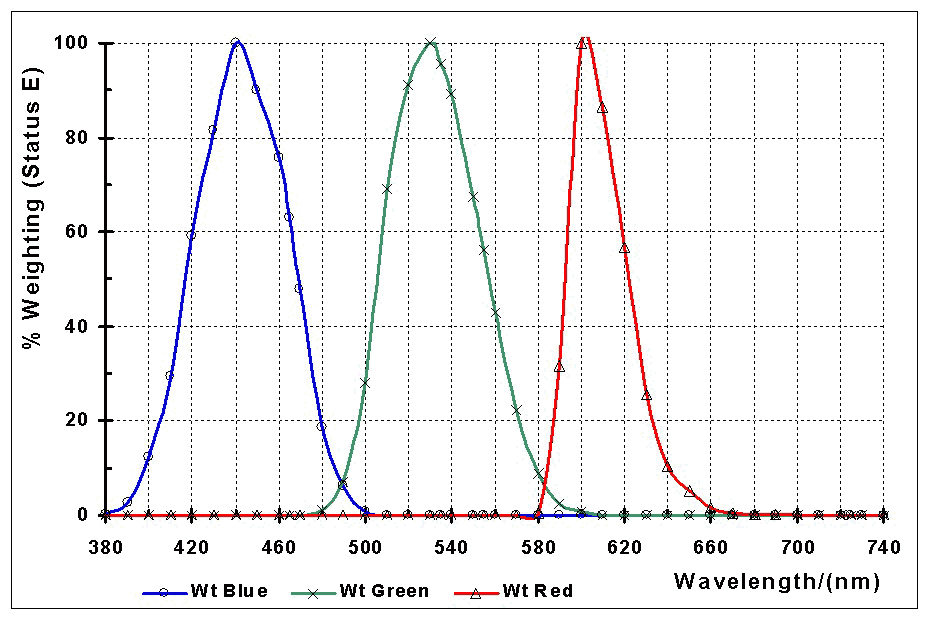
Figure 3: Spectral
characteristics of the Status E filters (Europe)
|
Status T
|
Status T is generally
accepted in North America as the Wide Band Graphic Arts filter response
characteristics. The green and red transmitting filters match
the response of the Status E filters, however the blue transmitting
filter (y density) has a peak transmittance at a longer wavelength than
Status E and, on average, gives lower values of density. The
differences between the two sets of blue filter responses are shown in
Figure 4.
|
Figure 4: Blue filter response
for Status T and E
|
Polarisation filter
It is generally agreed that
polarisation filters can give less difference between the density
values of a wet and a dried printed sheet. However the use of
polarisation filters in a densitometer is controversial since the
effect is not always consistent, there is the possibility of distortion
of the spectral response and there are no published standards for the
use of polarisation filters.
Print control strips
It is difficult to isolate
areas on a printed image that are suitable for use in printing process
control, as a result a test strip is often printed in an area that is
normally hidden or discarded in the final product. The
control stripe has a series of test areas whose density values can be
used in the control of various aspects of the printing
process. The size of the test areas should be larger than the
aperture of the densitometer.
A typical general-purpose
process control strip or colour bar may include the following elements.
|
|
Solids
of each of the process colours and paper (cyan, magenta, yellow, black,
paper).
The solids are used to determine
solid ink density, a parameter that is used in all the tone value
calculations.
|
|
|
Three-quartertone,
midtone and quartertone tints of the process colours (cyan, magenta,
yellow, black).
The tone values are used to
determine the dot gain in the shadow, midtone and highlight areas of
the print.
|
|
|
Two-colour
overprint solids (cyan + yellow, magenta + yellow, and cyan + magenta).
The two colour overprints allow
the determination of trapping.
|
|
|
Grey-balanced
three colour overprint (cyan + magenta + yellow), solid,
three-quartertone tint, midtone tint and quartertone tint.
The solid three colour overprint
is used to assess the grey balance
|
|
|
Where
spot colours or additional colours are used then solids and tonal tints
of these colours should be included.
|
Greyness and hue error
Definition
Greyness and hue error and
are measures of the non-ideal nature of the ink-substrate combination,
the values are used as quality control tests and are applied to
incoming ink or paper/board and during a production run.
|
Greyness:
|
Characterizes
the relative achromatic content of a print made with a process-ink.
|
|
Hue
error:
|
The
hue error characterises the amount of unwanted absorption of a print
made with process-ink.
|
If the values vary during a
production run, then it is an indication of contamination of the
printing plates or the ink.
Explanation
The density values of a solid
process-ink patch can be thought of as the sum of three contributions.
(greyness)+
(hue error) + (ideal process-ink)
The greyness contribution
adds equally to each density value. The hue error
contribution adds to just one of the density values.
Consider a yellow solid patch
with the values:
|
|
Solid
print density
|
yellow
= 1.48D,
|
magenta
= 0.17D,
|
cyan
=0.08D
|
This is equivalent to the sum
of the following contributions:
|
|
Greyness
contribution
|
yellow
= 0.08D,
|
magenta
= 0.08D,
|
cyan
= 0.08D
|
|
|
Hue
error contribution
|
yellow
= 0.00D,
|
magenta
= 0.09D,
|
cyan
= 0.00D
|
|
|
Ideal
ink contribution
|
yellow
= 1.40D,
|
magenta
= 0.00D,
|
cyan
= 0.00D
|
Method
The measurements are made on
the solid patch of the cyan, yellow or magenta ink. The solid
ink patch is measured and the c, y and m density values units of the
patch are noted. The values are examined and sorted into the
highest (H), the middle (M)
and the lowest (L).
|
Equation
2: Greyness is given by
|
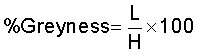
|
|
Equation
3: Hue Error is given by
|
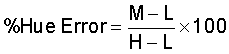
|
The values obtained refer to
the properties of the printed patch, so it is not necessary to take
into account the density of the unprinted substrate.
Example: The yellow solid patch is measured and the
values:
|
|
Solid
print density
|
yellow
= 1.48D,
|
magenta
= 0.17D,
|
cyan
=0.08D
|
are obtained,
|
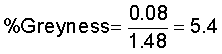
|
,
|
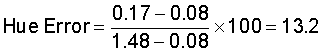
|
Table 4
shows Example values that are expected for different types of print
process.
|
|
Table 4: Example hue error and greyness values
for process inks
|
|
|
|
Type
of print
|
Cyan
|
Magenta
|
Yellow
|
|
|
|
Hue
|
Grey
|
Hue
|
Grey
|
Hue
|
Grey
|
|
|
|
Glossy,
sheet offset
|
20
|
14
|
46
|
14
|
5
|
6
|
|
|
|
Glossy,
web offset
|
21
|
21
|
50
|
18
|
6
|
15
|
|
|
|
Web
newsprint
|
28
|
42
|
58
|
34
|
10
|
25
|
|
It should be remembered that
lower values of hue error and greyness represent a process-ink with
properties closer to the ideal.
Tone value, apparent dot area (A%),
The apparent tone value is on
a printed sheet is often different from that intended in the image file
or on the plate. There are two reasons for the change in
apparent area.
|
Physical dot gain:
|
describes
the change in the printed dot size due to the action of the transfer
process of the ink from the plate to the substrate and spreading out
(wicking) of the ink into the substrate.
|
|
Optical dot gain:
|
describes
the apparent increase in dot size arising from the scattering and
refraction of light within the print layer and substrate.
|
Definition
The tone values or dot area
of a print is the percentage of the surface that appears to be covered
by dots from single process-ink, ignoring light scattering in the print
substrate and other optical phenomena.
Method
The apparent area is
determined using the Murray-Davies equation. Three density
values are needed.
|
|
The density of the
unprinted substrate
|
D0
|
|
|
The density of the 100%
(solid) patch
|
Ds
|
|
|
The density of the #
#% (tint) patch
|
Dt
|
|
Equation 4
|
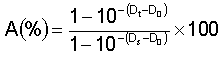
|
The appropriate c or y or m
density values are used in the equation according to the colour of the
ink under test.
Tone value increase, dot gain (TVI %)
Definition
The tone value increase is
the difference in tone value between any two steps in the printing
process. Modern definitions include electronic data and
measured values on any media.
A statement of the tone value
increase should include a statement of steps in the printing process
that are being compared. For example:
|
|
Case
1,
|
TVI
% =
|
electronic
file to printed sheet
|
|
|
Case
2,
|
TVI
% =
|
printing
plate to printed sheet.
|
Explanation
The TVI or dot gain value
gives a measure of the likely tonal quality of the print. The
tonal balance of the print depends on the dot gains of the inks being
similar, which is critical for grey balance, and for maintaining
critical overprint colours such as flesh tones, green grass and blue
sky.
The screen areas of the test
patches are picked to correspond to three characteristic tonal regions
of an image, highlight (25%), midtone (50%) and shadow(75%).
Excessive dot gain in highlights make pastels nearly impossible to
reproduce. Excessive dot gain in the shadows will cause loss
of detail in these areas of the image.
|
Example:
|
A
72% tone value (Equation 4) from a 50% input film printing tone value
is reported as 22% TVI.
|
|
|
Table
5: Example dot gain values for the midtone (50%) screen dot-area
|
|
|
Substrate
and print method
|
Black
|
Cyan
|
Magenta
|
Yellow
|
|
Glossy,
sheet offset
|
22
|
20
|
20
|
18
|
|
Glossy,
web offset
|
24
|
22
|
22
|
20
|
|
Web
newsprint
|
34
|
33
|
30
|
28
|
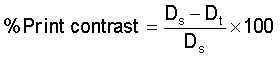
Print contrast
Definition
The print contrast is the
ratio of the difference in density between the solid area and the
shadow tint area to the density of the solid, expressed as a
percentage. This indicates the printing system's capability
to hold image detail in the shadow tone region.
Explanation
The shadow detail carries
important information in many images, subjective evaluation such as
“flat” or “jumps off the page” indicate a low or a high print contrast
value. As a result, the % print contrast is determined using
the shadow (80% or 75%) screen dot-area patch.
Method
The appropriate c or y or m
density values are used in the equation according to the colour of the
ink under test. Since the values refer to the quality of a
print, no correction is made for the density of the unprinted substrate.
Two measurements are needed
|
|
The
density of the solid patch
|
Ds
|
|
|
The
density of the tint patch
|
Dt
|
The print contrast is
determined from
|
Equation5
|
|
Example
|
|
Table
6: Example of print contrast values for process-inks
|
|
|
Substrate
and print method
|
Black
|
Cyan
|
Magenta
|
Yellow
|
|
Glossy,
sheet offset
|
40
|
36
|
36
|
30
|
|
Glossy,
web offset
|
36
|
31
|
31
|
28
|
|
Web
newsprint
|
24
|
22
|
22
|
18
|
Ink trapping
The four process-inks are
printed in sequence, with black printed either first or last, then
cyan, followed by magenta and then yellow. The inks are
formulated to with a graduation in tack according to the sequence of
application by the press. This ensures that an ink will
adhere to the previous ink layer that was printed rather than lifting
it from the paper.
An ink printed on top of
another ink in a multi-colour press may not achieve the same density as
when printed directly onto bare paper or board. One
explanation for this is that the second-down ink does not transfer as
efficiently to ink on paper as it does to paper alone.
Factors influencing trap include ink film thickness, ink tack and
viscosity, printing sequence and the mechanical adjustments on the
press such as rollers and impression settings.
Poor trapping will result in
a hue shift in overprint reds (magenta and yellow), greens
(cyan and yellow), and blues
(cyan and magenta). Both overtrapping and undertrapping occur.
Definition
Ink trapping is the relative
transfer of an ink onto previously deposited ink(s) as compared to the
transfer of the same ink onto the bare paper/substrate.
Method
Ink trapping compares the
density of the overprinted ink layers with that of the same ink layer
printed directly onto the substrate. The appropriate c or y
or m density values are used in the equation according to the top
colour of the overprint.
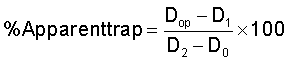
Identify the top colour, or
second ink laid down, of the two-colour overprint target to be
measured. When taking measurements for this patch, use the
filter for the top colour. For example, for a green overprint
made by printing yellow over cyan, a yellow density (blue optical)
filter is used.
Perform the following
measurements using the filter for the top colour:
|
|
Measure
the density of the solid patch of the two-colour overprint.
|
Record
this value as Dop
|
|
|
Measure
the density of the solid patch of the first laid down colour (for the
yellow on cyan example this would be the cyan solid patch).
|
Record
this value as D1
|
|
|
Measure
the density of the solid patch of the second laid down colour (for the
yellow on cyan example, this would be the yellow solid patch).
|
Record
this value as D2
|
|
|
Measure
the density of the unprinted substrate
|
Record
this value as D0
|
The apparent trapping of the
top colour ink on the ink first laid down is given by the Preucil
quation:
Example
|
|
Table
7: Example ink trapping values for wet on wet application of process
inks
|
|
|
Over
print hue
|
Red
|
Green
|
Blue
|
|
Print
order
|
M
then Y
|
C
then Y
|
C
then M
|
|
Trapping
of
|
Y
on M
|
Y
on C
|
M
on C
|
|
Glossy,
sheet offset
|
70
|
80
|
75
|
|
Glossy,
web offset
|
65
|
75
|
70
|
|
Web
newsprint
|
55
|
65
|
60
|
|
|
|
|
H46: Measurement of Print
|
©
James H Nobbs
[Colour4Free]
|