|
H44: Image CYM to Print Colour XYZ
|
©
James H Nobbs
[Colour4Free]
|
|
|
|
|
The
way in which a coloured printed image is created by the four-colour
process is described in an earlier document.
The
colour seen by the eye in each part of the image arises from the
blending of the light reflected by a mosaic of dots, as shown in Figure
1.
Each
type of dot will contribute a proportion of light in the red, the green
and the blue bands of the spectrum and the net effect of the local
mosaic of dots is determined by the sum of these contributions.
|
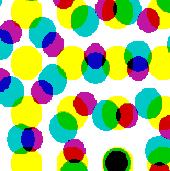
Figure 1: Dot mosaic in a
half-tone print
|
The
steps in the conversion of the intended colour of a printed area (XYZ)
to the relative areas of the substrate covered by dots of cyan, yellow
and magenta ink (CYM) is not straightforward.
|
It
is simpler to consider the reverse transformation, taking a set of
known values for CYM and determining the colour of the print (XYZ). The
steps involved are summarised by Figure 2.
The
relationships used to model each of the steps are given in the
following section.
|
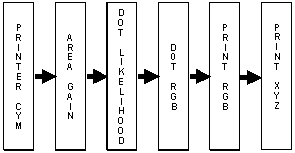
Figure 2: Conversion of CYM dot
areas to print colour XYZ
|
Factors
involved
The four-colour printing
process creates tonal scales by printing patterns of coloured
dots. There is set of dots for each of the process inks, cyan
(C), yellow (Y), magenta (M) and black (K).
|
Each
position on the print can have a dot created by a single layer of ink
or two layers of ink. The need to print three layers of ink
is replaced by substituting a dot from the black ink. Each
dot position can be one of the eight colours shown in Table 1.
Different
fractional areas of the each type of coloured dot produce a range of
colours within the print; the variation in dot area and dot colour
within each small region on the print creates the impression of a
coloured image with a wide tonal range.
|
Table 1: Dot colours in the half tone process
|
|
Dot
Colour
|
Ink
Layers
|
Dot
Type
|
|
White
|
None
|
wht
|
|
Cyan
|
Cyan
|
cyn
|
|
Yellow
|
Yellow
|
ylw
|
|
Magenta
|
Magenta
|
mgt
|
|
Red
|
Yellow
+ Magenta
|
red
|
|
Green
|
Yellow
+ Cyan
|
grn
|
|
Blue
|
Cyan
+ Magenta
|
blu
|
|
Black
|
Black
|
blk
|
The
amounts of light reflected by an area of the print can be predicted
from the fractional areas of the each type of dot by the Neugebauer equations using the principles of additive colour mixing.
Intended print area (S) and effective
area (A)
The instructions sent to the
inkjet printer or to the printing plate production process are the
fraction of the local geometric area to be printed with dots of process
ink. In this analysis the intended printed fractional areas
are represented by SC, SY, SM, (and SK). The term S is used since this
area was once known as “Screen Area”.
The dot area can absorb
light as if it has a greater area than the intended printed area; this
arises from the boundary/edge region of the dots having slightly
different light absorbing properties to those of the dot
centre. The change is called the dot-gain.
The magnitude of the dot gain depends on the value of SC,
SY or SM. There is zero dot gain when the
fractional area is zero and when it is 1.0 (full area coverage, no
edges).
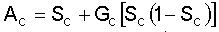
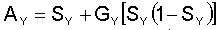
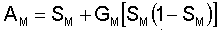
The effective dot areas AC,
AY, and AM are given by:
Where G is the gain factor
that has values typically in the range 10% to 25%.
Dot
likelihood, e.g. P(cyn)
The probability of finding a
point on the print having just a cyan ink layer is the fraction area AC,
however the same point may also be have a yellow ink layer or a magenta
ink layer or both. The probability of a cyan ink only layer
is given by:-
|
Equation
3
|
(probability
of cyan ) × (probability of not
yellow ) × (probability of not
magenta)
|
|
Equation
4
|
P(cyn)
= AC(1 – AY)(1 – AM)
|
Where
the probability
|
of
|
not finding a magenta layer is (1 – AM)
|
|
and
of
|
not finding a yellow layer is (1 – AY).
|
|
The
probabilities, or fractional areas, of each of the eight types of
coloured dot are given in Table 2.
|
Table 2: The probability of finding a
particular dot colour
|
|
Dot
Colour
|
Ink
layers
|
Fractional
area of mosaic
|
|
White
|
None
|
P(wht)
= (1 – AC)(1 – AY)(1 – AM)
|
|
Cyan
|
Cyan
|
P(cyn)
= AC (1 – AY)(1 – AM)
|
|
Yellow
|
Yellow
|
P(ylw)
= AY (1 – AC)(1 – AM)
|
|
Magenta
|
Magenta
|
P(mgt)
= AM (1 – AC)(1 – AY)
|
|
Red
|
Yellow
+ Magenta
|
P(red)
= AY AM (1 – AC)
|
|
Green
|
Cyan
+ Yellow
|
P(grn)
= AC AY (1 – AM)
|
|
Blue
|
Cyan
+ Magenta
|
P(blu)
= AC AM (1 – AY)
|
|
Black
|
Cyan
+ Yellow + Magenta
|
P(blk)
= AC AY AM
|
Dot R,
G, B
|
Typical
values for the percentage of the light reflected in the each of the
wavelength bands for each type of dot relative to those of the white
substrate are shown in Table 3. They are also known as the colour separation values.
|
Table 3: Reflectance values of single print
and over prints of the process colours
|
|
Dot
Type (i)
|
%
Red
|
%
Green
|
%
Blue
|
|
wht
|
100.0
|
100.0
|
100.0
|
|
cyn
|
5.38
|
39.54
|
63.35
|
|
ylw
|
97.77
|
88.86
|
10.95
|
|
mgt
|
88.75
|
8.14
|
39.01
|
|
red
|
86.91
|
6.74
|
2.94
|
|
grn
|
5.27
|
33.39
|
7.35
|
|
blu
|
4.88
|
3.53
|
23.89
|
|
blk
|
4.78
|
2.66
|
1.95
|
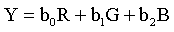
Print
RGB, colour of the mosaic
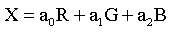
A summation is made of the
red contributions from each of the eight types of dot in the
reproduction mosaic to give an estimate of R, the amount of light in
the red wavelength band that is reflected by that area of the print.
|
Equation 5
|

|
Similar equations estimate
the amount of green (G) and blue (B) light reflected by the area of
print.
Although there are eight
terms on the right hand side of each equation they are derived from
only three quantities, the fractional dot areas of the print of C, Y
and M.
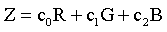
Print
XYZ, colour of the mosaic
The values of R G and B can
be re-expressed in terms of X Y and Z by a set of three linear
equations.
Inverting
the process, X Y Z to dot areas C Y M K
Equation 5 shows that the
amount of red light from an area on the printed image is linked to the
fractional dot areas of all four of the inks. In addition
there are non-linear effects such as dot-gain, As a result, a number of
corrections and adjustments of the dot areas must be made in order to
obtain an acceptable quality of colour reproduction.
|
|
|
|
H44: Image CYM to Print Colour XYZ
|
©
James H Nobbs
[Colour4Free]
|