|
© James H Nobbs |
|
|
|
|
Instruments have been available for measuring the reflective properties of flat, uniform surfaces for many years. The use of microprocessor chips and the developments in optics has meant that the ease of use and the performance of the instruments have improved dramatically and the cost and size has been reduced. As a result, the use of instrument based methods for the assessment of colour and colour difference is becoming normal practice.
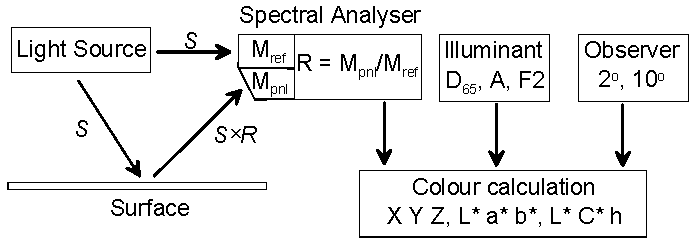
There are two types of instrument in common use for the assessment of colour, reflectance spectrophotometers and tristimulus colorimeters. In both cases light is shone onto the object and part of the reflected light is collected, analysed in some way and the intensity recorded. The instruments measure the reflection properties of the test surface compared to those of a reference “perfect” white surface under the same conditions. Instruments are generally able to determine colour differences at least 10 to 20 times smaller than can be seen with the human eye
Reflectance spectrophotometer instruments are more versatile than filter-based colorimeters and the data obtained from a spectrophotometer can be used in the prediction of colour by computer-based systems for the formulation of inks and paints. In general, the reflectance spectrophotometer is the more accurate and reliable of the two types of machine, but is also the most expensive costing between two to five times more than a tristimulus colorimeters.
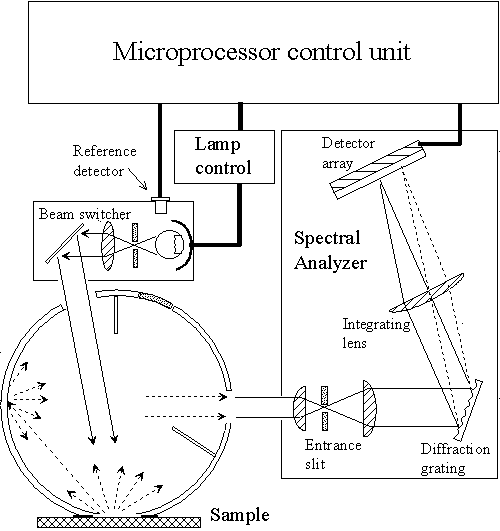
Figure 2 illustrates a reflectance spectrophotometer with an 8/T optical geometry. The sample is illuminated with collimated beam of light at 8° to the sample normal. The light trapped within the sphere is collected from part of the sphere wall and passed into the spectral analyser. The total intensity emitted by the lamp is monitored at all times by a reference detector mounted in the lamp housing.
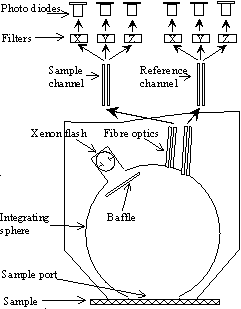
The tristimulus colorimeter analyses the collected light by measuring the intensity transmitted through each of three different optical filters. Figure 3 illustrates a filter based tristimulus colorimeter with a T/6 optical geometry. The sample is illuminated with diffuse illumination provided by a xenon flash unit and an integrating sphere. The cone of rays reflected by the sample at 6° 2° to the normal is collected by a fibre optic light guide (sample channel). A second fibre optic guide collects light reflected from part of the sphere wall (reference channel). The sample and reference light is analysed by splitting into three equal portions and passing each portion through an optical filter. A light sensor mounted behind each filter detects the intensity of light transmitted. The signals from the photo-sensors are processed to give L*, a* and b* for the selected Standard Illuminant and Observer combination.
|
|
Low cost compared to a reflectance spectrophotometer |
|
|
Mechanically robust, suitable for use in a production environment |
|
|
The filters used to analyse the spectral composition of the collected light determine the illumination and observer function for the colour coordinate determination. |
|
|
The combination of Illumination and Observer function is determined at the time of construction The filters may change characteristics with time. |
|
|
The lack of spectral reflectance values means that the instrument cannot be used to calibrate a computer based formulation prediction system. |
|
|
The lack of spectral information means that the instrument cannot be used for assessment of tinctorial strength |
Standard CIE optical geometry
An instrument should be able to give repeatable measurements of the same sample. It is also reasonable to expect that different instruments of the same type from the same manufacture will give similar results when measuring the same samples. Ideally, instruments of the same type should give the same result, irrespective of the manufacturer. In an attempt to achieve this aim the CIE have defined four standard optical geometries and in general instruments of the same optical geometry will give similar results.
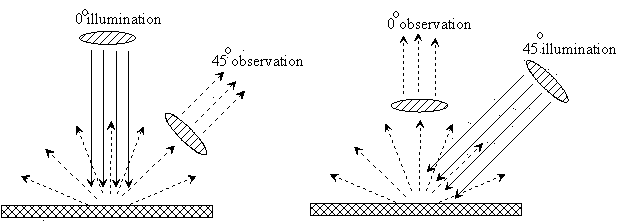
In all four geometry’s, it is assumed the instrument is measuring the colour of a smooth, flat surface. The definitions specify the angular distribution, relative to the normal to the surface, of the illuminating light and of the observed light. The geometry of an instrument is denoted by two terms separated by a backslash, for example 0/45 and 45/0 are shown in Figure 4. The first number refers to the illumination geometry and the second the observation geometry.
|
The first two instrument geometry definitions are illustrated in Figure 4. The sample is illuminated with a collimated beam of light at either 0° or 45° to the surface normal. The reflected light is collected from a narrow range of angles centred on the observation angle. |
CIE 0/45 geometry |
CIE 45/0 geometry |
|
|
||
The observation angle can be either 45° or 0° relative to the surface normal, corresponding to illumination at 0° and 45° respectively. In principle, since the photons in the light beams do not "know" which way they are travelling, both the 0/45 and the 45/0 arrangements should measure identical values for the same sample.
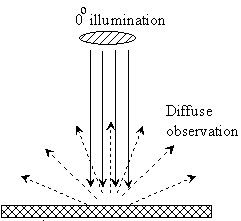
In the third arrangement (0/T), shown in Figure 5, the sample is illuminated with a collimated beam of light normal to the surface and all of the reflected light is collected, irrespective of direction (diffuse observation).
|
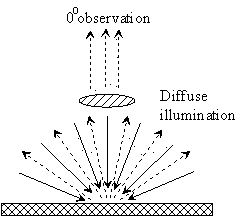
In the fourth optical geometry (T/0), the sample is illuminated with light of equal intensity from all directions (diffuse illumination) and a narrow cone of rays is collected centred on the normal to the sample surface.
In principle, both these arrangements give identical measurements for the same sample. |
CIE 0/T geometry
|
CIE T/0 geometry
|
The definition does not restrict the collimated beam to the direction normal to the surface, an angle of up to 10° with the surface normal is allowed. As will be explained later, a small angle has some advantages over a 0° system. The equivalent notation for a system with an angle of 8° for example is 8°/T and T/8° respectively.
The integrating sphere is the optical component used to generate the condition of diffuse illumination or diffuse observation. It consists of a hollow metal container, not necessarily spherical in shape, whose inner surface is covered with a very high reflectivity, matt coating material. The coating is commonly made from either barium sulphate, magnesium oxide or poly(tetra fluoroethylene) powder. The coated sphere not only creates the diffuse condition but also "traps" light within the system to give a higher intensity of collected light than a 0/45 or a 45/0 arrangement.
|
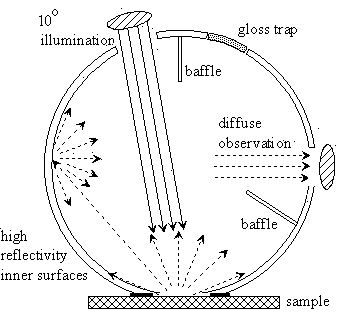
Commonly there are four apertures or ports in the spheres surface to allow light to enter and leave. The arrangement for a 10°/T system is shown in Figure 6. At the bottom of the sphere is the sample port; the object to be measured is placed flush against the port. The illumination port is in the diametrically opposite portion of the sphere wall, and in this case is at 10° to the normal to the sample surface. A lens system directs a collimated beam of light onto the sample surface.
Light reflected by the sample is scattered off the walls and is trapped inside the sphere until it either is absorbed or leaves through one of the apertures. |
|
The observation port is in the sphere wall, 90° around from the sample port. A lens collects light coming from the opposite wall of the sphere. This part of the wall will receive light scattered from all other parts of the sphere and, in turn, from all directions of the light reflected by the sample.
Highly reflecting baffles are mounted inside the sphere to prevent light being collected directly from the illumination port or directly from the sample itself.
|
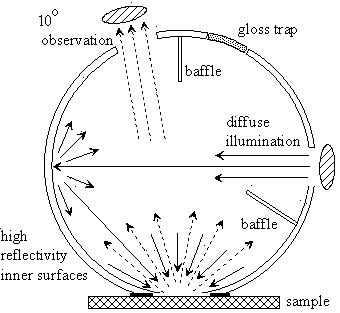
The fourth geometry illuminates the sample with diffuse light, and collects a narrow cone of rays reflected from the sample. The alternative arrangement is achieved by exchanging the positions of the observation and illumination ports as is shown in Figure 7.
The illumination is directed into the sphere from the port at 90° to the sample position. The light from the lamp is scattered diffusely off the inner walls and is in effect trapped inside the sphere. A portion of the diffuse illumination falls onto the sample. The observation port collects the light reflected by the sample along a narrow range of directions centred on 10° to the surface normal. |
Figure 7: Integrating sphere with a T/10 geometry |
The integrating sphere geometries shown in Figure 6 and in Figure 7 include a gloss trap. This is a section of the sphere wall that absorbs all of the radiation that falls on it. The position and size of the trap acts to remove from the measurements the specular or mirror like portion of the light reflected from the sample. Modern integrating sphere instruments have the option of automatically replacing the gloss trap with a highly reflecting section. In this way, the operator can choose to make measurements either in the specular excluded (SPEX) or in the specular included mode (SPIN). The instrument geometry notation T is changed to D when specular light excluded measurements are being made to indicate that only diffuse (D) light directions instead of the total (T) are being used.
Most modern instruments measure the ratio of the light reflected from the sample to that reflected by a reference white material. In a true doublebeam arrangement, the sample and reference panels are measured simultaneously. In a pseudo doublebeam system, the sample and reference are measured sequentially and it is assumed that the power output and spectral distribution of the light source is stable over the short time between measurements. In both systems, any variation in the illumination intensity with wavelength is automatically taken into account. In other words, provided the light source gives sufficient radiation to obtain a reasonable response from the detection system, the spectral power distribution of the illumination should have no effect on the measured values. In reality this is not the case for certain samples.
There are two types of light source in common use, a xenon flash lamp and a tungsten halogen bulb.
The xenon flash lamp provides a spectrum similar to that of daylight and by passing the light through a suitable filter, a reasonable simulation of CIE Illuminant D65 is possible, including the ultra-violet portion of the spectrum. This has the advantage of stimulating any fluorescent dyes or pigments that may be present in the sample. Such instruments, when correctly calibrated, can be used to assess whiteness. When first developed, the xenon flash systems were expensive to buy and maintain; however developments in optical and electronic components means that this is no longer the case.
In systems that use a tungsten halogen lamp for illumination, the lamp is operated continuously during the measurement. Therefore the instruments are simpler in construction, both electronically and optically, less expensive to buy and easier to maintain than flash based systems. The spectral power distribution is similar to that of CIE Illuminant A with the majority of the intensity being in the orange, red and infrared part of the spectrum. There is comparatively little ultra-violet light present and such instruments are not recommended for measurements of the “whiteness” of samples containing fluorescent dyes or pigments.
The accurate measurement of the colour characteristics of samples that show thermochromism be a problem, the colour of a thermochromic sample changes with temperature.
A xenon flash based system exposes the sample to a short pulse of light, a few milliseconds, and there is unlikely to be any change in the temperature of the sample. A tungsten halogen based system illuminates the sample for a longer time, and there is a greater proportion of infrared light present in the illumination. Therefore, it is more likely for the sample to warm up during measurement than with a xenon flash system. This problem has been partly overcome by the use of low power tungsten halogen lamps and an optical filter to remove the infra-red component of the radiation.
A white standard, usually a ceramic tile, and black standard, either a tile or a light trap, is provided with each instrument. The reflectance ratio spectra of the white and the black standards are known and stored as data in the computer memory. During the calibration process each tile is measured and, in simple terms, the black tile or trap is used to set a zero reflectance point for each wavelength and the white tile is used to determine a scale factor for each wavelength.
The calibration standards must be treated with care, kept clean and replaced in the protective packaging immediately after use. Never use the white tile as a backing material during the measurement of semi-transparent materials.
|
|
A set of standards panels should be measured regularly and the results keep in a logbook. |
|
|
Special “standard” ceramic tile sets are available which have been selected for stability and to display errors in measurement. |
Instrument maintenance
Modern colour measuring instruments are reliable and require little maintenance, however this does not mean that checks on performance are unnecessary. The properties of the optical components will gradually change with time. The double beam principle combined with the calibration process means that such changes are, to a certain extent, automatically taken into account.
|
|
The instrument should be kept in a clean, dry and dust free environment. |
|
|
The instrument should be handled with care, a drop or a bang may move the optical components out of alignment. |
|
|
It is important when an instrument is moved from a cold room to a warmer one to allow time for it reach room temperature. Moisture can condense from the warm air onto the exposed faces of the cold optical components and result in spurious results. |
|
|
The inside of the integrating sphere should be occasionally examined through the sample port for the presence of dust, fluff or other debris. Contamination will reduce the sensitivity of the device. In some cases contamination can be removed by gentle suction through a small, soft rubber tube. Take care; the white coating can be extremely fragile. |
|
|
|
|
© James H Nobbs |