|
H36: Instrument Assessment of Colour Difference
|
©
James H Nobbs
[Colour4Free]
|
|
|
|
Instrument based methods of
judging the colour appearance measure the colour co-ordinates of the
test and of the standard panel and then determine the total colour
difference dE*, and the component differences dL* (lightness) dC*
(intensity of colour) and dH* (hue).
CIE L*a*b* Colour difference
Determination of dE*
|
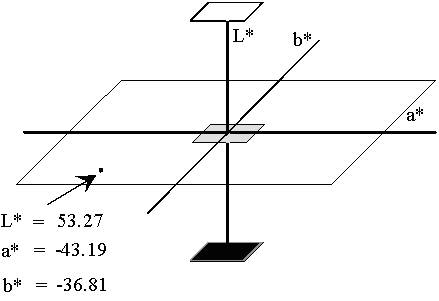
The
CIE L* a* b* system includes an equation for the total colour
difference between a trial and standard sample. The total
colour difference is the distance between the two points representing
those colours in the colour space as illustrated in Figure 1.
The
distance, expressed as dE*, is determined using the laws of right
angled triangles.
|
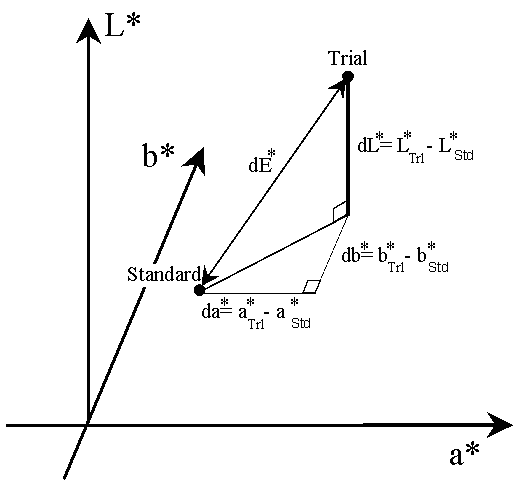
Figure 1: CIE L*a*b* colour
difference
|
|
|
|
|
Where
|
|
|
It
is worth remembering that the scaling of the colour space is such that
a distance of 1 between the points representing the colour of two
samples should be just visually perceptible.
|
This means that if a large
number of people were asked to judge two samples with dE* = 1, about
50% of observers would say that there was a difference in colour, the
other 50% would say the two colours matched. An example
calculation is given later.
Interpretation of dE*
The following is a guide to
the interpretation of CIE L* a* b* colour difference values.
|
|
dE* <
0.8
|
the
trial is an acceptable colour match to the standard
|
|
|
0.8 ≤
dE* ≤ 1.2
|
the
trial is a possible colour match to the standard
|
|
|
dE* >
1.2
|
the
trial is not a colour match to the standard
|
In practice a customer and a
supplier would include a dE* limit as part of the colour specification
of the object. The limit could be larger than 1.0 or smaller
than 1.0, depending on the type of product and the importance of
obtaining an accurate colour match to the standard.
Reliability of a dE* < 1
pass/fail limit
The correct answer as to
whether a trial colour matches that of the standard is the majority
decision of a group of colourists. An instrumental assessment
based on the condition that dE* must be less than 1 for a match, will
disagree with the majority about 19% of the time.
Instrumental judgements made this way are no more reliable, on average,
than judgements made by a colourist.
The instrumental method has
the advantage of being repeatable, most instruments and sample pairs
can be measured with a repeatability of dE* to better than ±0.20.
Colour difference splitting dL*, dC*
dH*
|
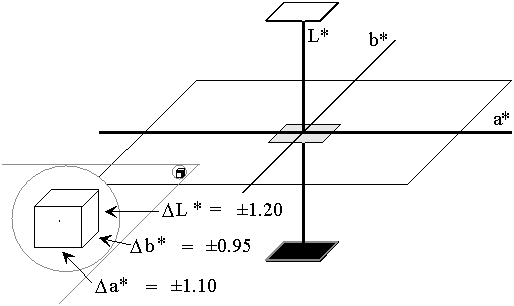
Splitting
the total colour difference (dE*) into differences:
in lightness (dL*);
in chroma (dC*);
in hue (dH*),
as
shown in Figure 2, is a great aid to the interpretation of the nature
of a colour difference.
|
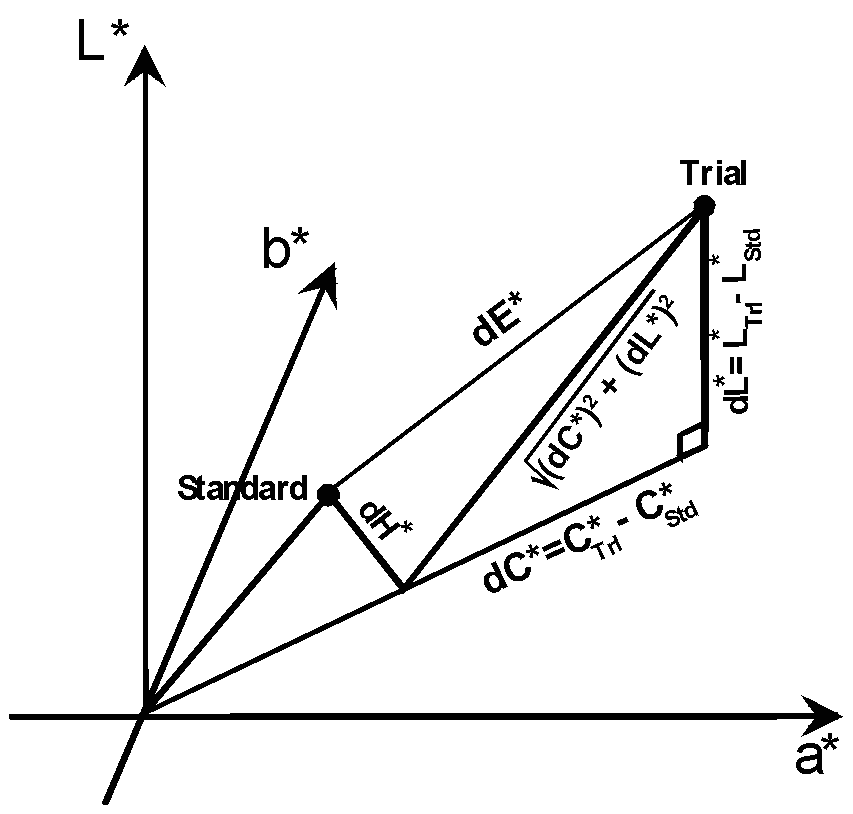
Figure 2: dL* dC* dH*
Colour difference splitting
|
Calculation
|
Total
difference
|

|
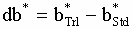
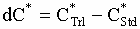
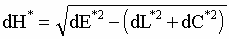
Subtracting
the contributions of the lightness (dL*) and chroma (dC*) differences
from the total colour difference (dE*) leaves the hue difference (dH*).
|
Lightness
difference
|
Chroma
difference
|
Hue
difference
|
|

|
|
|
The hue
difference equation cannot provide a sign for the value of
dH*. The convention is that it takes the same sign (±)
as the difference between the hue angles of the trial and standard.
|
|
If
|
|
then
dH* is positive
|
|
|
If
|
|
then
dH* is negative
|
Interpretation
dL*,
lightness difference
|
|
-0.50 <
dL* < 0.50
|
the
trial is the same lightness as the standard
|
|
|
dL* ≥
0.50
|
the
trial is lighter than the standard.
|
|
|
dL* ≤
-0.50
|
the
trial is darker than the standard.
|
dC*,
chroma difference
|
|
-0.50 <
dC* < 0.50
|
the
trial is the same chroma as the standard.
|
|
|
dC* ≥
0.50
|
the
trial is more intense (stronger) than the standard.
|
|
|
dC* ≤
-0.50
|
the
trial is less intense (weaker) than the standard.
|
dH*,
hue difference
|
|
-0.50 <
dH* < 0.50
|
the
trial is the same hue as the standard.
|
|
|
dH* ≥
0.50 or dH* ≤ -0.50,
|
the
trial is a different hue to the standard
|
Hue
difference description
The hue
difference is described using one or more of the primary hue names
yellower, greener, redder or bluer. For example if an orange
coloured standard is considered then the trial will be described as
either yellower or redder than the standard.
The CIE L*a*b* system
provides a method of obtaining the hue difference description from the
positions of the trial and standard on the a* b* plane. An
arc is imagined drawn from the position of the standard to the trial
and then continued on around the hue circle. The hue
associated with the first axis crossed by the arc is quoted followed,
enclosed in brackets, by the hue of the second axis crossed.
This is illustrated in Figure 3 and Figure 4.
|
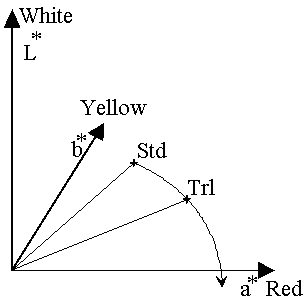
Figure 3: Trial is
redder (bluer)
|
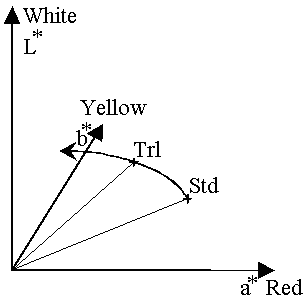
Figure 4: Trial is
yellower (greener)
|
The appropriate hue
difference terms are those neighbouring the standard in the hue circle,
as shown in Table 1.
Table 1: Hue difference terms
|
|
Hue
of standard
|
Hue
difference terms
|
Hue
of standard
|
Hue
difference terms
|
|
|
|
Red
Orange
Yellow
Lime
green
|
Yellower
or bluer
Yellower
or redder
Greener
or redder
Greener
or yellower
|
Green
Cyan
Blue
Magenta
|
Bluer
or yellower
Bluer
or greener
Redder
or greener
Redder
or bluer
|
|
Example
colour difference calculation
|
|
Name
|
L*
|
a*
|
b*
|
C*
|
ho
|
|
|
|
Standard
|
53.68
|
-9.20
|
-36.56
|
37.70
|
255.9
|
|
|
|
Trial
|
54.90
|
-10.02
|
-35.50
|
36.89
|
254.2
|
|
|
|
Difference
|
1.22
|
-0.82
|
1.06
|
-0.81
|
-1.7
|
|
|
|
Total
|
dE*
= 1.81, trial does not match the standard
|
|
|
Lightness
|
dL*
= 1.22,
trial is lighter
than the standard
|
|
|
Chroma
|
dC*
= -0.81, trial is more intense (stronger) than the
standard
|
|
|
Hue
|
dH*
= -1.07, trial is greener (yellower) than the standard
|
Setting pass/fail tolerance values
A reliable method of
assessment of colour difference is important for both scientific and
economic reasons. The incorrect rejection of a batch of
material has the consequence of extra cost and time in unnecessary
colour correction. Costs are also incurred if a batch is
incorrectly accepted at an early stage in a process and then found
unacceptable after further steps in manufacture have been carried out.
Consider the case of a
manufacturer making repeated batches of a product based on matching to
the same standard colour. The small variations in the
manufacturing process will produce batches whose colour co-ordinates in
L* a* b* space will lie in a small volume surrounding the
standard. Some of these batches will have been judged
visually as an acceptable match to the standard colour and others
rejected.
It is possible to imagine
drawing a smooth, three-dimensional surface around the standard such
that the majority of points representing accepted batches lie within
the volume enclosed by the surface. This is known as an
acceptance ellipsoid since, on average, the shape of the volume is
ellipsoidal. Extensive investigation has shown that the
shape, size and orientation of the acceptance ellipsoid in CIE L* a* b*
space varies with the colour of the standard.
The CIE L*a*b* colour
difference equation assumes, irrespective of the colour of the
standard, the acceptance volume is a sphere of radius 1 unit.
Unfortunately pass/fail decisions based on the CIE L*a*b* (1976)
equation with a limit of dE* = 1 are, on average, less reliable than
visual judgements made by a single colourist. The simplest
method of improvement is to assign individual tolerances either to dL*,
da* and db* or to dL*, dC* and dH*.
dL* da*
db* acceptance limits
The
colour of the standard is measured and plotted in colour space as shown
in Figure 5. In this case the standard is a medium lightness,
intense, cyan blue colour.
|
Figure
5: Standard in CIE L*a*b* colour space
|
Figure
6. dL*, da*, db* acceptance volume
|
|
The
assignment of individual tolerances to dL*, da* and db* defines a
rectangular box around the standard as illustrated in Figure
6. The orientation of the sides of the box, parallel to the
L* a* b* directions, is the same for all positions of a standard in
colour space.
If the limits have been set
correctly then batches with colour co-ordinates that lie within the box
would be judged as acceptable colour matches to the standard.
The utility of such a tolerance volume can be assessed by comparing it
with the shape of the acceptance ellipsoid.
|
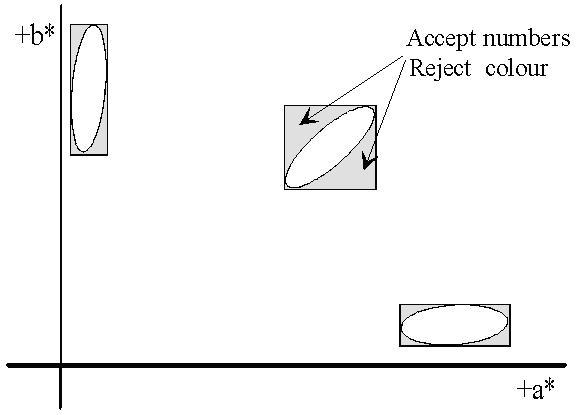
Figure 7: Magnified
acceptance ellipsoid areas in the a* b* plane superimposed on the da*
db* tolerance limits
|
Figure 7 illustrates this
process by considering just the hue plane, a* b*. In this
plane the true acceptance regions are ellipsoid shaped areas roughly
oriented towards the neutral point (0, 0). The tolerance
limits, da* and db*, define a rectangular area that encloses the area
of true acceptance and also a significant region in which colours
should be rejected. The reliability of instrumental pass/fail
judgements based on setting individual tolerances for dL*, da* db* is
better than CIE dE* judgements, but by no means the best that can be
obtained.
dL* dC* dH* acceptance limits
The system where individual
limits to dL*, dC* and dH* are set is shown in Figure 8. The
acceptance volume is similar in shape to that shown in Figure 6, but
has a different orientation. The orientation of the dL* dC*
dH* acceptance volume relative to the L* a* and b* axis changes as the
standard moves in colour space, as illustrated in Figure 9.
|
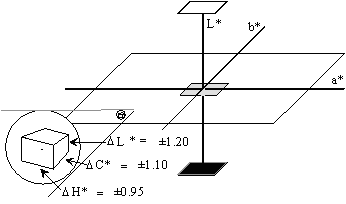
Figure
8: The acceptance volume based on dL*, dC*, dH* limits
|
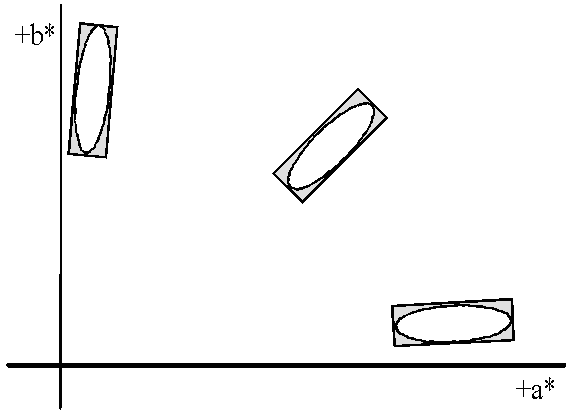
Figure 9: Magnified
acceptance ellipsoid areas in the a* b* plane superimposed on the dC*
dH* tolerance limits
|
It is clear from Figure 9
that the tolerance area defined by limits dC* and dH* will still
include an area in which colours should be rejected. However,
the size of this "incorrect decision" area is less than that when
tolerances are based on da* db*, (illustrated in Figure 7).
The change in orientation of the dL* dC* dH* tolerance volume with
position of the standard is similar to the change in orientation of the
acceptance ellipsoid. Therefore pass/fail judgements based on
dL*, dC* and dH* tolerance limits are significantly more reliable than
those based on dL*, da* and db*.
Colourist terms versus colorimetric
terms
The terms used routinely by
people working in the colour using industries are often different from
the set defined by the CIE. Typically the Lighter-Darker
judgement is retained, a second adjective pair is used to describe a
coloration strength difference and a third pair is used to describe a
difference in the purity of the colour.
It is often possible to
associate the use of these terms with particular directions of colour
difference on a plot of dC* versus dL*. The position of the
standard is at the origin and the trial is represented by the
point dC*, dL*. This is illustrated for the paint
and the textile industry in Figure 10 and Figure 11 respectively.
The use of the word pair
stronger/weaker often leads to confusion. Colourists in the
paint and ink industries use the pair to describe an excess or deficit
of colorant in the trial compared to the standard, whereas the CIE use
the pair to describe a higher or lower chroma of the trial compared to
the standard. In some trial-standard comparisons the two
judgements would agree while in others they would not.
|
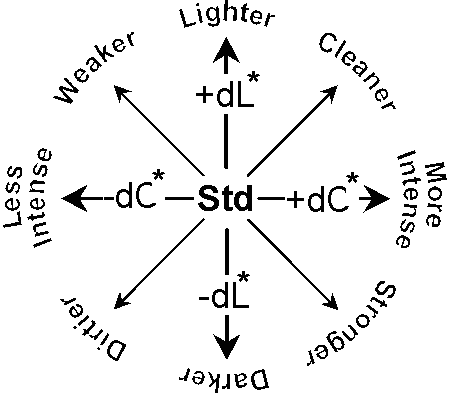
Figure 10: Colour
difference terms used in the paint and ink industries
|
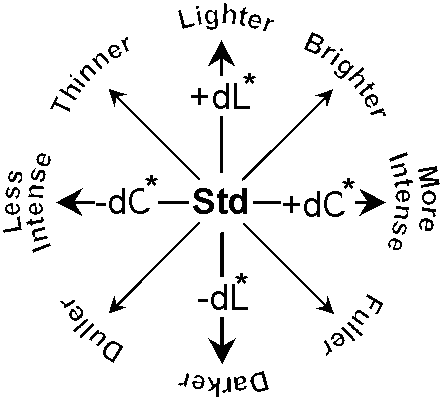
Figure
11: Colour difference terms used in the textile industry
|
|
Figure
12 illustrates the changes in L* and C* that occur when either blue
colorant is added to a white paint or increasing amounts of blue dye
are applied to a fabric.
Initially
the value of L* decreases as C* increases (case 1). In this
region the colorimetric and the colourist's terms for the difference
between the standard and trial shown would agree.
Eventually C* reaches a
maximum value and further additions of colorant will decrease both L*
and C*, as illustrated by case 2.
|
 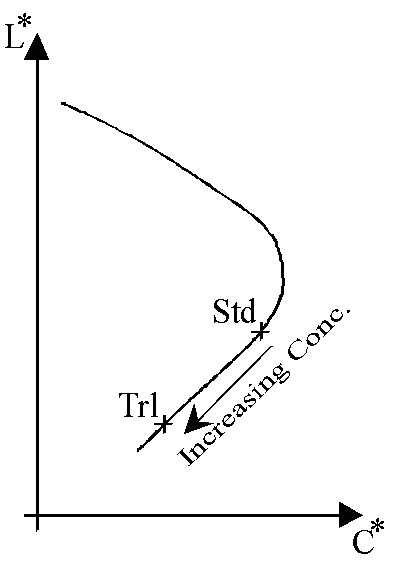
Figure
12: Case 1 (left) colourist’s
and colorimetric terms agree.
Case 2 (right), terms disagree
|
In case 2, the colourist
would still describe the trial as stronger than the standard, however
in terms of the numerical chroma difference (dC* < 0 ), the
trial is judged less intense (weaker) than the standard.
|
|
|
|
H36: Instrument Assessment of Colour Difference
|
©
James H Nobbs
[Colour4Free]
|