|
H32: Putting Numbers to
Colour: CIE X Y Z
|
©
James H Nobbs
[Colour4Free]
|
|
|
|
In
1931, the 8th session of the Commission Internationale de l' Eclairage
(CIE) held in Cambridge, England, devised a system that provided
positive tristimulus values for all visible colours. This was
based on defining a new set of additive primaries X, Y, and Z based on
the R G B set. The response of the eye is defined in terms of
three new reference primaries X, Y and Z derived mathematically from
the three real primary light sources R G and B. The X, Y, and
Z stimuli are defined so that:-
|
|
The
X Y Z tristimulus values of all real colours are positive.
|
|
|
The
Y tristimulus value is proportional to the luminance.
|
|
|
The
X Y Z values of the visible colours have the widest possible range of
values.
|
|
|
Equal
amounts of X, Y and Z has the same colour appearance as an equal energy
white.
|
Imaginary
primaries
The X, Y, and Z stimuli that
satisfy these requirements cannot be physically created as light
sources, for this reason they are termed imaginary primaries.
|
|
The
X stimulus represents a red more saturated than any spectral red.
|
|
|
The
Y stimulus represents a green more saturated than any spectral green.
|
|
|
The
Z stimulus represents a blue more saturated than any spectral blue.
|
Colour
matching functions
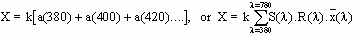
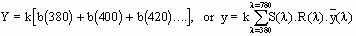
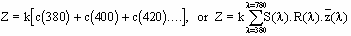
The
colour matching functions x(λ), y(λ) and z(λ), are a wavelength-by-wavelength
representation of the amounts of the “imaginary” primary light sources,
in T units, that are needed to match the colour sensation produced by a
unit intensity of light with a narrow band of wavelengths centred on λ.
The functions are plotted against wavelength in Figure 1.
|
Each
of the curves contains the same area so that an equal energy white will
have
X = Y = Z
as
well as
R = G = B.
The
values shown in Figure 1 and used throughout this work, are taken from
the ASTM document E308-85 (1985), "Standard methods for computing the
colors of objects using the CIE system".
Imaginary
primaries
The
x(λ), y(λ) and z(λ) functions are calculated from the
experimentally determined r(λ),
g(λ) and b(λ) values by using equations 1 to 3.
|
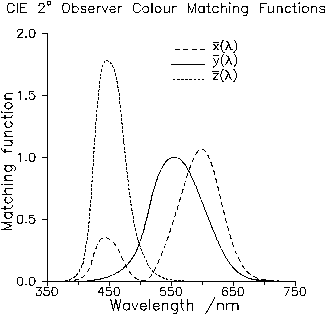
Figure 1: CIE 2°
colour matching functions x(λ) y(λ) z(λ)
|
The
constants in equation 2 were chosen so that the y(λ)
values agree with the CIE luminosity function V(λ),
so that the value at 555 nm is 1.00, y(555)=1.000.
Note,
in absolute terms, 1 Watt of light intensity at 555 nm provides 683
Lumens of luminous flux.
|
Equation 1
|

|
|
Equation 2
|

|
|
Equation 3
|

|
2°
Standard Observer
The
colour matching functions x(λ), y(λ) and z(λ), were defined in 1931. They are known as the
2o
observer colour matching functions,
because the data was experimentally determined using a visual field
subtending an angle of 2° at the eye. The light in this type of visual
field just falls onto the foveal pit region of the retina.
10°
Standard Observer
The accuracy of the 2°
Observer data was questioned by a number of people and it was
eventually recognised that the values were too low in the region 380 nm
to 460 nm. In 1964 the CIE recommended a new standard
observer based on measurements made with a visual field subtending an
angle of 10° at the eye. The light in this type
of visual field falls onto the foveal pit region of the retina and onto
part of the surrounding regions. The colour matching
functions and X Y Z values obtained using this data are denoted by the
subscript 10, X10 , Y10 and Z10.
Calculation
of X Y Z tristimulus values
|
The
following illustrates the method of calculating the X, Y and Z values
that specify the colour stimulus from a surface viewed under a
particular illuminant.
The
following additional parameters are used
|
|
|
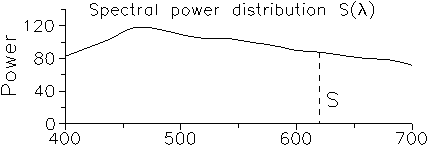
S(λ)
|
The
relative spectral power of the illuminant at wavelength λ
|
|
R(λ)
|
The
fraction of incident light reflected by the surface at
wavelength λ
|
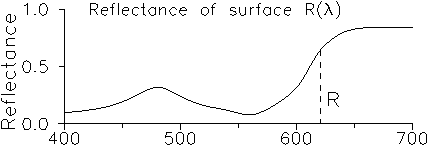
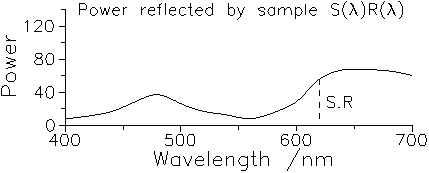
Figure
2: The power reflected by the sample at 620 nm.
|
|
As
in the case of the R G B calculation, the spectrum of the light
reflected by the surface is split into a number of thin bands, the
colour of each band is then individually matched with the X, Y and Z
stimuli.
An
example is given in the Figure 2 for the band of wavelengths centred on
620 nm.
|
|
At
620 nm relative power of illumination is:
|
S(620)
= 87.70.
|
|
The
reflectance of the sample is:
|
R(620)
= 0.6400
|
|
The
relative amount of light at these wavelengths entering the eye is given
by
|
|
|
I(λ)
= S(λ).R(λ)
|
|
|
I(λ)
= 87.70 x 0.6400 = 56.13 units.
|
The calibration values shown
in Table 1 show that
to match a stimulus from unit
intensity of light at 620 nm,
|
|
0.8544 TX
units of the X source (red),
0.3810 TY
units of the Y source (green) and
0.0002 TZ
units of the Z source (blue) are needed.
|
To
match the stimulus from an intensity of 56.13 then the amounts a, b and
c of the X, Y and Z stimuli are needed, where:-
|
So
that
|

|
A
similar calculation can be made to match the contribution of each of
the other thin wavelength bands in the spectrum of I(λ). By Grassman’s
laws it follows that the total amounts of the X, Y and Z stimuli needed
to match the colour appearance of the full spectrum entering the eye is
the sum of these contributions.
An
example calculation is shown in Table 1 at the end of this section.
The ASTM
308-85 standard provides tables of data at 5, 10 and 20 nm spacing
intervals. In general the narrower the spacing the more
accurate will be the tristimulus values obtained from the
summation. Summations over 5 or even 10 nm intervals are
recommended for the most accurate work, however for many practical
purposes summations over 20 nm intervals in the reduced wavelength
range of 400 nm to 700 nm provide useful results.
Normalisation
constant k
The normalisation constant
has a special role in the calculation, its function is to ensure that
the Y value of a perfectly reflecting white, R(λ)=1
at all wavelengths, has a value of 100. In other words the Y values are
scaled to go from 100 for the perfect white surface to 0 for the
perfect black surface.

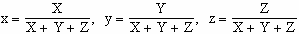
Chromaticity co-ordinates
The X Y and Z values provide
a numerical description of the colour of a surface. These
values are not easily related to the lightness, chroma and hue
attributes of a colour. Progress can be made towards this
type of description by using chromaticity co-ordinates.
The
information describing the intensity of the colour sensation and the
hue can be crudely separated out by considering the following
process. If the intensity of light incident on the eye is
increased then the values of X Y and Z will change in
proportion. An observer would say that the luminosity had
increased but the hue and saturation of the colour remain the
same. The combined effect of hue and saturation is known as
the chromaticity. The chromaticity of two colours is
the same if the ratios of the amounts of X, Y and Z that match them
are the same. Such colours only differ in
luminosity. These ratios are termed chromaticity
co-ordinates and are represented by the lower case letters x , y and z.
|
and of course
|

|
Chromaticity
diagram
Only
two of the three chromaticity co-ordinates are needed to specify the
chromaticity of a colour, the value of the third can be calculated from
the other two using equation 4.
|
The
two chosen co-ordinates, usually x and y, can be plotted on ordinary
graph paper, as shown in Figure 1. Such a plot is termed a
chromaticity diagram and it is a useful way of representing the hue and
saturation of a colour.
The
usual arrangement for the chart is with x as the abscissa and y as the
ordinate. The diagram also shows the line formed by the x, y
values of monochromatic light at each wavelength in the
spectrum. This line is called the spectrum locus. The spectrum locus plus the line
joining the two ends (the purple line) enclose a region within which
the co-ordinates of all real, visible colours must lie.
|
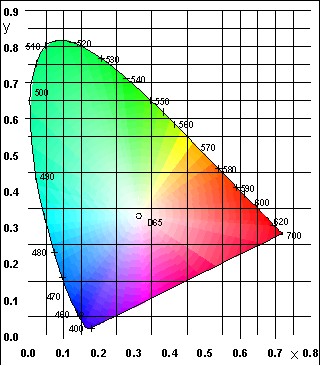
Figure
3: The CIE chromaticity chart
|
The
diagram has a number of useful properties.
|
a)
|
The
co-ordinates of all colours that can be created by the additive mixture
of light from two sources lie on the line joining the two points
representing those sources.
|
|
b)
|
The
co-ordinates of colours produced by mixing light from three light
sources all lie within the triangle joining the points representing
those sources
|
|
c)
|
The
co-ordinates of the complement of any colour is found by drawing a line
from the co-ordinates of that colour to
the illuminant and then extending until it cuts the
spectrum
locus. The complementary colour will lie on the extended line
joining the illuminant to the spectrum locus. Dominant Wavelength and
Purity
|
Dominant
Wavelength and Purity
Dominant
wavelength, λd
Figure 4 shows the
chromaticity co-ordinates of the following colours.
Sample
M, x=0,1500, y=0.6000. Light source
D65, x=0.3127, y=0.3290
The
dominant wavelength (λd)
of a colour is the wavelength of monochromatic light which, when added
in the correct proportion to light from the Illuminant, produces a
mixture that has the same hue and saturation as the given colour.
|
The
points representing the sample (M) and the Illuminant (D65) are plotted
on the chromaticity diagram, as shown in Figure 4.
A
line is drawn from D65 to M and extended until it cuts the spectrum
locus at A.
The
wavelength at the point of intersection (A) is λd.
For
sample (M), λd
= 514 nm
Excitation
purity Pe
The
excitation purity Pe of a colour is the relative proportion of
light of the dominant wavelength in a mixture with light of the
Illuminant that has the same hue and saturation as the given colour.
|
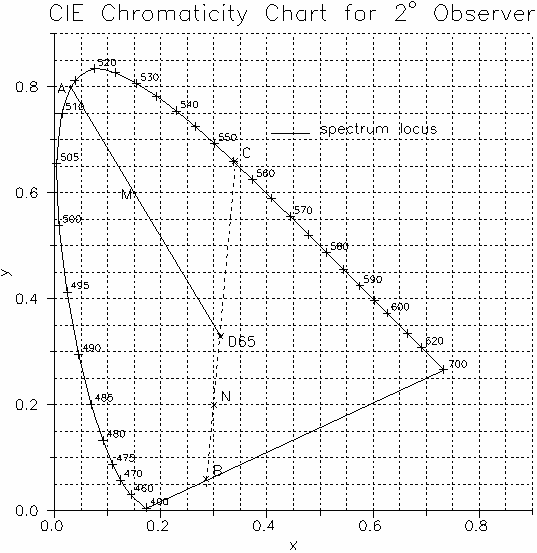
Figure 4: Determination of dominant wavelength and
excitation purity
|
The
excitation purity is the ratio of the distance (M to D65),
to the distance (A to D65).
For
sample (M), Pe = 0.583
In some cases, for example a
sample with the colour co-ordinates N in the figure, the extrapolation
cuts the purple line (B) rather than the spectrum locus. In
these instances the complementary wavelength λc is quoted. This is found by
extending the line backwards until it cuts the spectrum locus (C).
For
sample (N), λc
= 556 nm
The excitation purity is the
ratio of the distance (N to D65), to the distance (B to D65).
For
sample (N), Pe = 0.490
Limitations
of the CIE X Y Z system
It is
clear that while it is possible to define a colour by specifying
|
|
the
values of X, Y and Z
|
|
and
|
the
illuminant (D65 or A or F7 for example)
|
|
and
|
the
observer (2° observer or 10°
observer for example)
|
|
and
|
the
optical geometry of the colour measuring instrument (0/45,
D/8 or T/6 for example)
|
The
specification is by no means ideal for the following reasons.
|
|
It
is difficult to interpret the hue, lightness and chroma of a colour
from the X, Y and Z values or the chromaticity co-ordinates.
|
|
|
A
numerical value for the difference in colour between two similar
samples is not represented by the difference in the tristimulus values
or the chromaticity co-ordinates.
|
Example
calculation
|
Table 1:
|
Spreadsheet calculation of X Y Z tristimulus
values for the 2° observer, D65 Illumination
calculated using data
at 20 nm intervals from 400nm to 700nm
|
|
λ
|
R(λ)
|
S(λ)
|
S×R
|
x(λ)
|
y(λ)
|
z(λ)
|
S×y
|
S×R×x
|
S×R×y
|
S×R×z
|
|
400
|
0.1000
|
82.75
|
8.27
|
0.0143
|
0.0004
|
0.0679
|
0.03
|
0.12
|
0.00
|
0.56
|
|
420
|
0.1200
|
93.43
|
11.21
|
0.1344
|
0.0040
|
0.6459
|
0.37
|
1.51
|
0.04
|
7.24
|
|
440
|
0.1600
|
104.86
|
16.78
|
0.3483
|
0.0230
|
1.7471
|
2.41
|
5.84
|
0.39
|
29.31
|
|
460
|
0.2400
|
117.81
|
28.27
|
0.2908
|
0.0600
|
1.6692
|
7.07
|
8.22
|
1.70
|
47.20
|
|
480
|
0.3200
|
115.92
|
37.09
|
0.0956
|
0.1390
|
0.8130
|
16.11
|
3.55
|
5.16
|
30.16
|
|
500
|
0.2400
|
109.35
|
26.24
|
0.0049
|
0.3230
|
0.2720
|
35.32
|
0.13
|
8.48
|
7.14
|
|
520
|
0.1600
|
104.79
|
16.77
|
0.0633
|
0.7100
|
0.0782
|
74.40
|
1.06
|
11.90
|
1.31
|
|
540
|
0.1200
|
104.41
|
12.53
|
0.2904
|
0.9540
|
0.0203
|
99.61
|
3.64
|
11.95
|
0.25
|
|
560
|
0.0800
|
100.00
|
8.00
|
0.5945
|
0.9950
|
0.0039
|
99.50
|
4.76
|
7.96
|
0.03
|
|
580
|
0.1600
|
95.79
|
15.33
|
0.9163
|
0.8700
|
0.0017
|
83.34
|
14.04
|
13.33
|
0.03
|
|
600
|
0.3200
|
90.01
|
28.80
|
1.0622
|
0.6310
|
0.0008
|
56.80
|
30.59
|
18.17
|
0.02
|
|
620
|
0.6400
|
87.70
|
56.13
|
0.8544
|
0.3810
|
0.0002
|
33.41
|
47.96
|
21.38
|
0.01
|
|
640
|
0.8000
|
83.70
|
66.96
|
0.4479
|
0.1750
|
0.0000
|
14.65
|
29.99
|
11.72
|
0.00
|
|
660
|
0.8400
|
80.21
|
67.38
|
0.1649
|
0.0610
|
0.0000
|
4.89
|
11.11
|
4.11
|
0.00
|
|
680
|
0.8400
|
78.28
|
65.76
|
0.0468
|
0.0170
|
0.0000
|
1.33
|
3.08
|
1.12
|
0.00
|
|
700
|
0.8400
|
71.61
|
60.15
|
0.0114
|
0.0041
|
0.0000
|
0.29
|
0.69
|
0.25
|
0.00
|
|
|
|
|
|
|
|
|
sum
|
sum
|
sum
|
sum
|
|
|
|
|
|
|
|
|
529.54
|
166.28
|
117.67
|
123.26
|
|
Normalisation
constant,
|
k
= 100/529.54 = 0.1888
|
|
|
X=
0.1888 x 166.28 = 31.40,
|
|
|
Y
= 0.1888 x 117.67 = 22.22,
|
|
|
Z
= 0.1888 x 123.26 = 23.28
|
|
|
|
|
H32: Putting Numbers to
Colour: CIE X Y Z
|
©
James H Nobbs
[Colour4Free]
|