|
H 12: Vision Properties and Effects |
© James H Nobbs |
Normal light (photopic vision)
The cone cells tend to be connected either individually or in very small groups to the nerve fibres and as a result photopic vision gives the highest degree of spatial resolution available.
Number of colours
Under ideal viewing conditions a normal observer can distinguish about 3 to 4 million separate colours. These are colours that can be seen as just visibly different from each other.
Low light (scotopic vision)
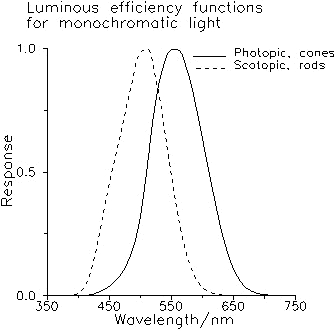
The photopic luminous response (cones) is most sensitive at a wavelength of 555 nm with a sensitivity of 683 lumens/Watt.
The rod cells are not individually connected to an optic nerve, several cells are connected to one nerve fibre and as a result scotopic vision is lower in spatial resolution than photopic vision.
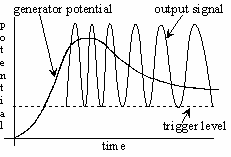
The instantaneous response of the eye to a continuous stimulus is different to that a few seconds later when the retina has become adapted. This process is best understood by first considering the way in which sensing cells operate. A stimulus to the cell generates an electrical potential within the cell termed the generator potential, when this potential exceeds a trigger level an output is generated in the form of a series of pulses. The magnitude of the pulse is constant but the frequency of pulses increases the higher the generator potential is over the trigger level.
|
The process of adaptation to a constant stimulus is illustrated Figure 3. When a continuous stimulus is applied, the generator potential rises to a peak value and then decreases to lower constant level. |
|
Adaptation has a number of important consequences. The most important is that the response of the retina changes according to the average illumination in the environment. Consequently, a white object is perceived as white under a wide range of illumination conditions. For example, the spectrum of light reflected by a white piece of paper is very different when illuminated by daylight to that under incandescent light, yet the paper is perceived as white under both conditions.
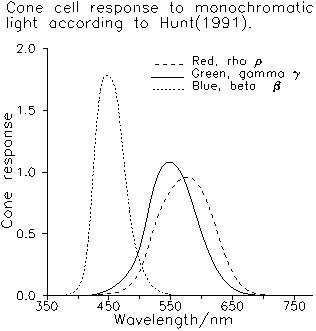
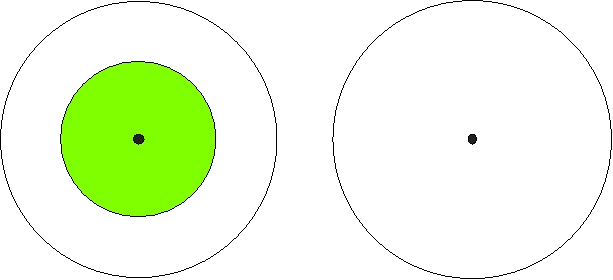
When the gaze is switched to a plane white piece of paper, an after-image of a magenta coloured circle will be visible instantly. Although all three cones are now receiving the same stimulus, the de-sensitised green cones give a lower output than the red or blue sensitive cones. The temporary imbalance gives the impression of a magenta circle. The magenta circle will disappear as the retina adapts to the new image conditions.
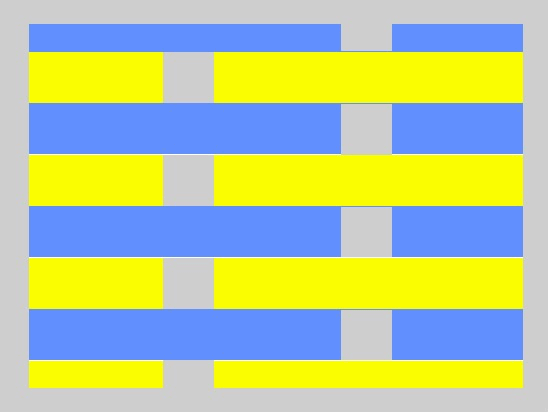
Simultaneous contrast describes one type of effect where the perception of colour of an area of an image is changed by the colour of the neighbouring areas. It arises from the many lateral interconnections between the nerve cells. The interconnections act by inhibiting the signal from one set of cells (group A) when a neighbouring set of cells (group B) are active and vice versa. The net effect is to emphasis boundaries between areas of different colour or lightness.
The lightness of the grey is between that of the yellow and of the blue. When the grey is viewed over the lighter, yellow background the grey will appear to be darker than its “true” colour. When it is viewed against the darker, blue background, the grey will appear to be lighter than its “true” colour.
Receptive field and lateral inhibition
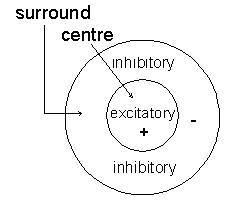
The simultaneous contrast effect arises from the many lateral interconnections between the nerve cells. The interconnections act by inhibiting the signal from a centre set of cells (excitatory) when a neighbouring set of surround cells (inhibitory) are active and vice versa. The concept is illustrated in Figure 6.
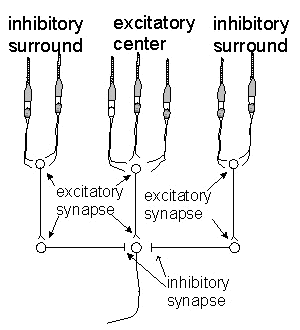
The interconnections between the signals are made by excitatory synapses and inhibitory synapses, as shown in Figure 7.
If the receptive field is covered by a uniform section of the image, then the level of suppression of the central signal by the surround could be called “normal”. Now imagine that the image falling on the surround is lighter than the centre, the suppression from the surround will be higher than the uniform image case. As a result, the image from the central elements will appear to be darker than in the uniform field condition.
Assimilation describes another type of effect where the perception of the colour of an area within an image is changed by the colour of the neighbouring areas.
|
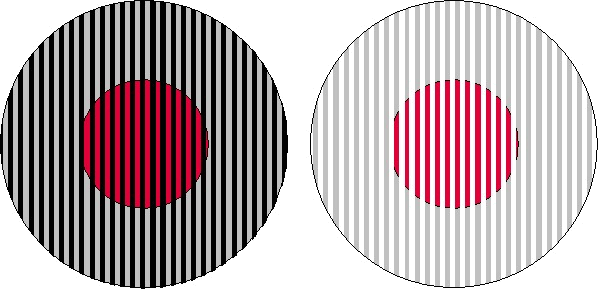
The effect is illustrated in Figure 8, where the same shade of red disk is covered by a grid of black lines (LHS) and by a grid of white lines (RHS). |
Figure 8: The assimilation effect. The two red disks are identical but appear to be different in colour. |
The LHS disk appears to be darker than the RHS disk. The appearance of the disk is changed by the nature of the overlapping grid and it has assimilated, or taken on, some of the characteristics of the grid. The black line grid makes the disk appear darker, the white line grid makes the disk appear lighter.
Ideal viewing conditions
From the structure of the eye it is clear that several viewing conditions must be controlled in order to establish reliable assessments of the colours of objects.
|
H 12: Vision Properties and Effects |
© James H Nobbs |